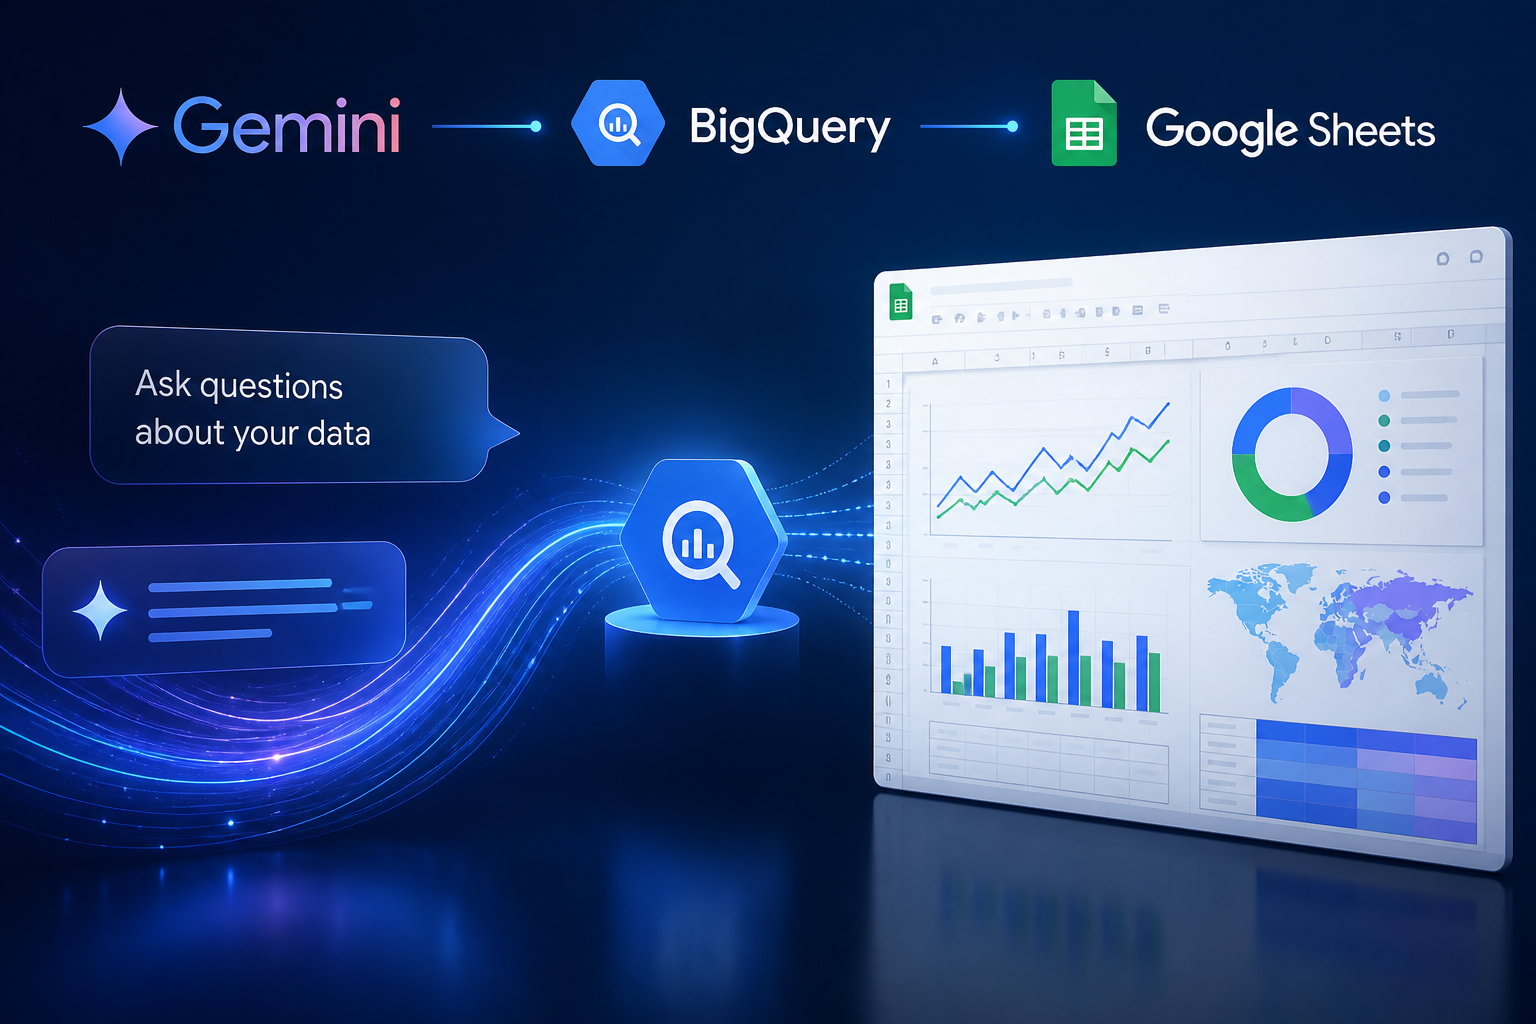
Google is bringing natural-language analysis of BigQuery data into Google Sheets. With this Gemini BigQuery Google Sheets feature, eligible users can ask questions about data connected through Connected Sheets, refine their questions in a conversation, and ask Gemini to assemble a dashboard in a new spreadsheet tab.
The important distinction: Gemini’s queries run against the full dataset in BigQuery, not only the rows currently visible in the spreadsheet. That makes the feature useful when a connected dataset is too large to inspect by scrolling through a sheet. Google announced the rollout on October 19, 2026, with gradual availability over up to 15 days for Rapid Release and Scheduled Release domains. Google’s announcement is the primary source for the launch details.
What Gemini can do with BigQuery data in Sheets
Once a spreadsheet is connected to BigQuery, you can open the Gemini side panel and ask questions in everyday language. Google’s examples include asking for total sales in a region during a particular quarter, then following up to compare that result with the same quarter in the previous year or identify products associated with an increase.
Gemini can also help move from exploration to presentation. Describe the analysis you want—for instance, a quarterly sales review with revenue by region, a monthly trend, and the top 10 products. Gemini presents a plan for review and can then build a new spreadsheet tab containing native, connected objects such as database formulas, pivot tables, and charts. Google says these objects can be refreshed, including through scheduled refreshes.
In practical terms, this brings three steps into one place: ask a question of the BigQuery data, investigate the answer with follow-up prompts, and turn the analysis into a view that colleagues can inspect in Sheets. It does not mean the spreadsheet has to display every source row before Gemini can analyze the connected data.
Why full-dataset access matters
A spreadsheet view is often only a window onto a much larger data source. If a table contains many records, the visible rows alone may not represent the time period, region, or product range you want to analyze. Google says Gemini’s BigQuery queries are run against the complete connected dataset rather than being restricted to what is visible in the sheet.
That difference can make a question such as “What were total sales in the Northeast last quarter?” more useful than a manual review of a partial display. You can then ask a related question in the same conversation, such as how the result compares year over year. This conversational workflow can help people explore a question before deciding which chart or table would best communicate the result.
Full-dataset querying should not be mistaken for a guarantee that every answer is automatically correct or that every interpretation matches your organization’s definitions. Terms such as “sales,” “active customer,” or “last quarter” can depend on field definitions, fiscal calendars, filters, and business rules. Review the result and the proposed dashboard against the source data and your team’s conventions before using it for decisions.
How to use Gemini with a BigQuery-connected spreadsheet
- Start with a spreadsheet connected to BigQuery. The announced capability works after BigQuery data has been connected to Sheets using Connected Sheets. If your workbook is not connected to BigQuery, this particular workflow is not available from that file.
- Confirm you have access to query the data. Google says the feature is available in connected spreadsheets to users who have permission to query the connected data. If Gemini is missing or cannot access the source, check your account eligibility and data permissions with your Workspace administrator or data owner.
- Open the Gemini side panel. In the connected spreadsheet, open Gemini’s side panel and ask a question about the analysis you need. Start with a clearly bounded request: specify the metric, relevant time period, and breakdown when those are important.
- Follow up to investigate. Use additional questions to compare periods, examine categories, or clarify an unexpected result. A useful sequence might begin with total revenue for a period, continue with a comparison to the prior year, and then ask which products or regions contributed to the difference.
- Ask for a dashboard when you know what you want to show. Describe the intended audience and the views you need. For example: “Build a quarterly sales review with revenue by region, a monthly trend, and our top 10 products.” Google says Gemini shares a plan for review before creating a new tab with connected objects such as charts and pivot tables.
- Review and refresh the output. Check labels, time periods, categories, and totals. The generated objects are connected and refreshable; Google describes scheduled refreshes as a way to keep dashboards up to date. Confirm your organization’s refresh expectations rather than assuming a dashboard updates instantly.
Prompting tips for more useful analysis
Natural-language analysis works best when a request names the measure and the dimensions you want to compare. “Show performance” is open-ended; “Compare quarterly revenue by region for this year and last year” gives a clearer analysis goal. If your organization uses a fiscal year or nonstandard reporting periods, state that explicitly rather than relying on an ambiguous phrase such as “last quarter.”
- Name the metric: Specify revenue, order count, margin, or another field your team recognizes.
- Set the time frame: Include the start and end dates, quarter, or comparison period, and clarify fiscal versus calendar periods when relevant.
- Choose a breakdown: Ask for results by region, product, channel, or another relevant category.
- Make comparisons explicit: Say whether you want a prior-period, year-over-year, or other comparison.
- Describe the dashboard’s purpose: Tell Gemini who will use the view and which questions the charts should answer.
- Check assumptions: If an answer seems surprising, ask Gemini to clarify the grouping or compare it with another view, then validate important figures against the data.
These are practical prompting suggestions, not a guarantee that Gemini will interpret every business term as intended. Clear wording helps make the requested analysis easier to review.
Availability and rollout
Google’s announcement lists availability for Business Standard and Business Plus; Enterprise Standard and Enterprise Plus; Google AI Pro and Ultra for consumers; Google AI Pro for Education; and AI Expanded Access. The rollout began October 19, 2026, for Rapid Release and Scheduled Release domains and was described as gradual, with up to 15 days for feature visibility.
Google says the feature is on by default and that there is no separate admin control for this feature. End users still need a spreadsheet connected to BigQuery and permission to query that data. Availability also depends on having an eligible plan or add-on. If the feature has not appeared in your account, check those requirements and allow for the announced rollout period.
Limitations and points to check
- A BigQuery connection is required. The announcement describes analysis in spreadsheets connected to BigQuery through Connected Sheets; it is not a general feature for any unconnected spreadsheet.
- Data permissions still apply. Google specifies that users need permission to query the connected data. Gemini does not replace access granted by the data owner or organization.
- Eligibility is plan-dependent. The listed editions and add-ons are specific; do not assume that every Google account or Workspace plan includes this capability.
- Rollout is gradual. A feature announcement does not mean it appears for every eligible user immediately. Google cited up to 15 days for visibility from October 19.
- Refreshable does not necessarily mean real-time. Google describes connected objects and scheduled refreshes, but the announcement does not specify a universal refresh interval or promise instant updates.
- Validate generated work. Review the plan, chart choices, metric definitions, and output before sharing or relying on the dashboard. Google’s announcement describes the workflow but does not specify every supported prompt, data-shape constraint, or error-handling behavior.
FAQ
Does Gemini analyze only the rows I can see in Google Sheets?
No. Google says Gemini queries the full connected BigQuery dataset, rather than limiting analysis to the rows visible in the spreadsheet.
Can I ask follow-up questions?
Yes. Google describes a conversational workflow in which users can ask an initial question and continue with follow-ups, such as comparing periods or investigating which products drove a change.
Can Gemini create a dashboard, or does it only answer questions?
It can do both. You can ask Gemini to build a dashboard, review its plan, and have it create a new tab with connected, refreshable objects such as database formulas, pivot tables, and charts.
Will the dashboard update automatically?
The generated objects are described as refreshable, and Google refers to scheduled refreshes. The announcement does not define a single refresh frequency for all dashboards, so check the refresh setup and data freshness that apply to your spreadsheet.
Why can’t I see Gemini for my BigQuery sheet?
Check whether the spreadsheet is connected to BigQuery, whether your account has permission to query the connected data, and whether your plan or add-on is listed as eligible. The feature began a gradual rollout on October 19, 2026, with visibility taking up to 15 days.
Can an administrator turn off this feature separately?
Google’s launch announcement says the feature is on by default and has no separate admin control. Access to the connected data remains permission-based, and broader account or service settings may still apply.
Bottom line
Gemini in Google Sheets offers a more conversational route from BigQuery data to analysis and a shareable spreadsheet view. Its key advantage is querying the full connected dataset even when the sheet does not show every row, then turning follow-up exploration into connected charts and pivot tables. For teams that already use Connected Sheets, the practical approach is to ask specific questions, review Gemini’s proposed dashboard, verify important results, and understand how refresh schedules affect data freshness.
